A single gas fill measurement tells an insulating glass manufacturer what one unit contains at one moment. Seeing what an entire production line has done over a week, a month or a quarter takes something more. That is the gap the Sparklike Handheld Nova web application is built to close.
From Single Reading to Fleet-Wide View
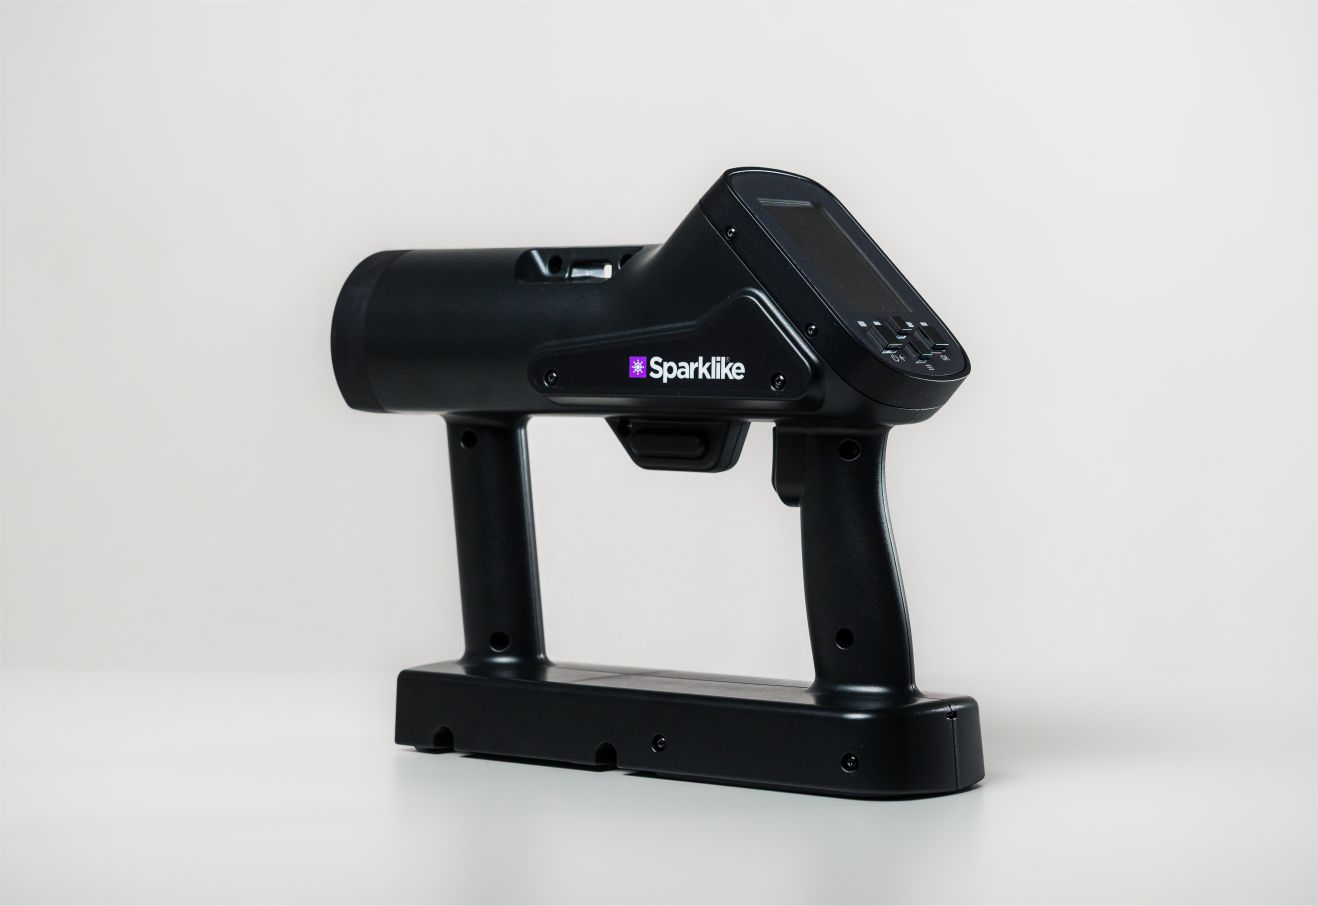
The Sparklike Handheld Nova stores more than 30,000 measurements onboard. Its companion web application connects to the device wirelessly, pulls that stored data into a browser, and organizes it into a set of views that turn individual readings into production-level intelligence, with no software installation required.
Spotting Trends Over Time
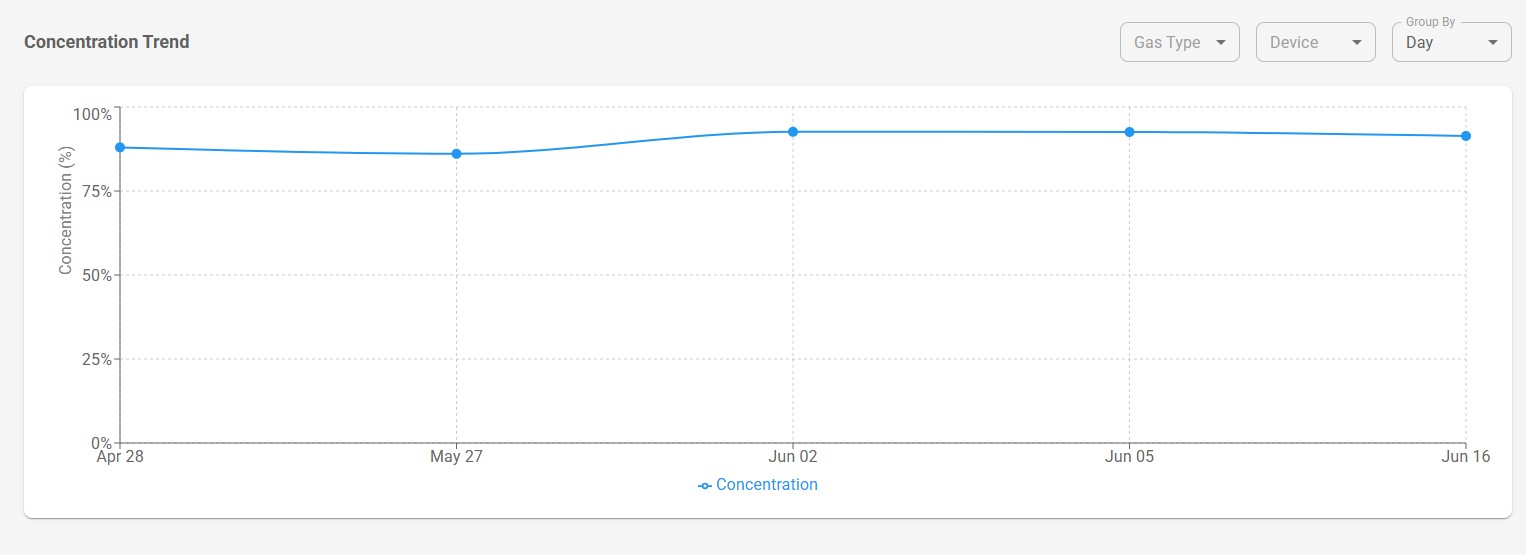
A concentration trend chart plots average gas fill percentage over time, grouped by hour, day or week. That makes it possible to catch patterns a single reading would never reveal: a gradual drift downward in fill level, a batch of units that consistently missed specification, or a production shift with unusually variable results. For quality teams, thisturns gas fill data into an active monitoring tool rather than a one-off compliance check.
Understanding the Spread of Results
A histogram view shows how measurements are distributed across concentration ranges, making it easy to see whether results cluster tightly around a target value or spread more widely than expected. Systematic under-filling can be invisible on a unit-by-unit basis but becomes clear once results are viewed in aggregate — often before it turns into a warranty or energy performance issue.
Verifying Measurement Activity
A measurement calendar shows, day by day across the month, how many measurements were taken. For manufacturers with a minimum daily measurement requirement for quality documentation, this offers a quick way to confirm the process is being followed, with lower-than-expected activity easy to spot immediately.
Drilling Into the Detail
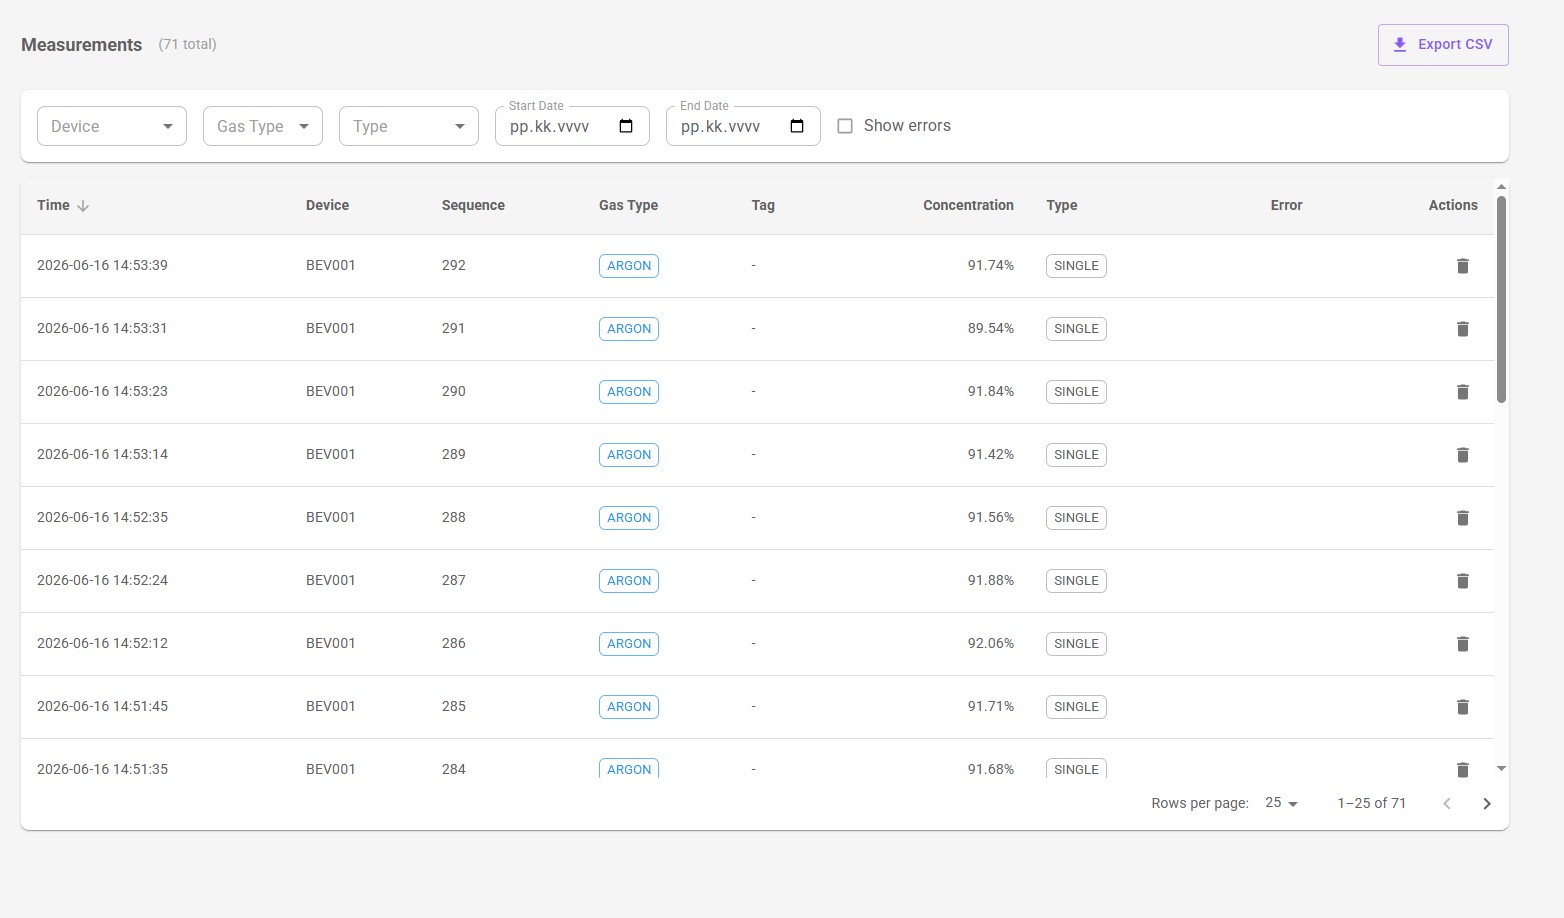
A full measurements table lists every reading with timestamp, device serial number, gas type, concentration result, error flags, and any barcode or QR traceability information attached to the unit. Results can be filtered by device, gas type, date range or errors, and the full dataset can be exported to CSV for sharing or archiving.
Managing Multiple Devices at Once
Manufacturers running several Handheld Nova devices across a line or multiple sites can view all of them in one place, filtering by individual device when needed. A statistics summary reports count, average, standard deviation and range for argon and krypton separately, giving a fast read on quality across an entire device fleet.
From Measuring to Understanding
The practical value lies in the shift from simply measuring gas fill to understanding gas fill trends. That shift supports better-informed decisions on filling equipment calibration, production process adjustments and quality documentation, and it allows manufacturers to act on emerging issues early rather than after the fact.
Read the original article: https://sparklike.com/en/igu-gas-fill-trends-how-to-turn-argon-measurement-data-into-
production-decisions/
Sparklike Handheld Nova: https://sparklike.com/en/sparklike-handheld-nova/
About Sparklike
Founded in 2000, Sparklike is a Finnish technology company specializing in non-destructive gas concentration measurement devices for the insulating glass industry. The company has delivered thousands of devices in more than 50 countries.
Website: www.sparklike.com